#Product Trends
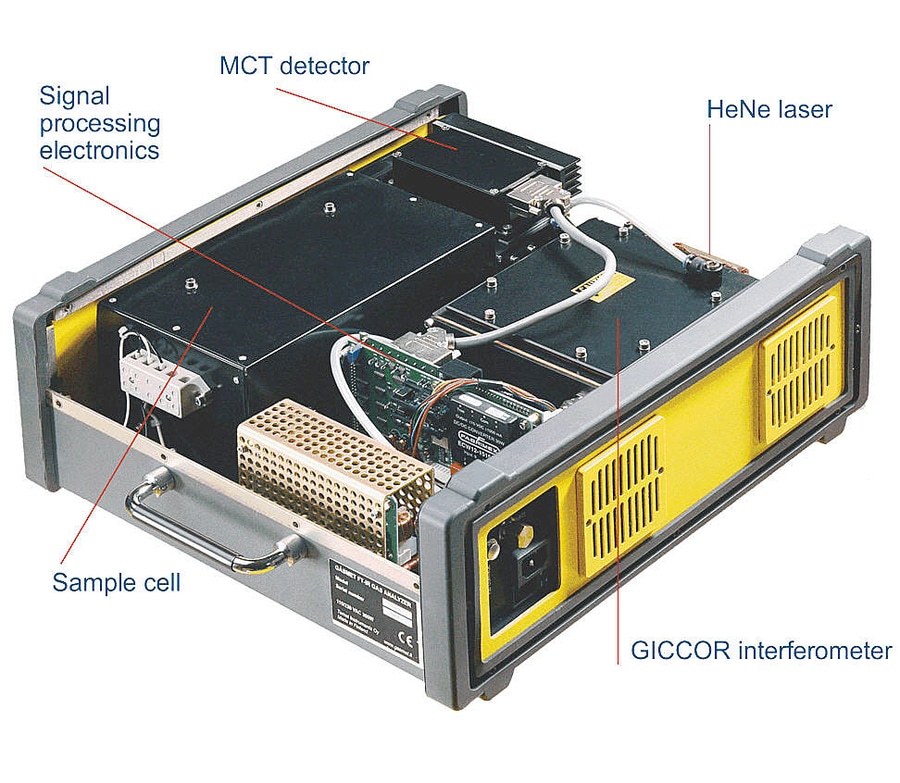
Gasmet™ FTIR gas analyzer
Gasmet™ FTIR gas analyzer collects a complete infrared spectrum (a measurement of the infrared light absorbed by molecules inside the sample gas cell) 10 times per second. Multiple spectra are co-added together according to selected measurement time (improving signal-to-noise ratio). The actual concentrations of gases are calculated from the resulting sample spectrum using patented modified Classical Least Squares analysis algorithm.
Gasmet™ FTIR key features:
1. Signal processing electronics with DSP (Digital Signal Processor) technology for high speed data collection.
2. The GICCORTM Interferometer is the most reliable one on the market today. During the manufacturing process, each interferometer must pass extensive shock and temperature stability tests (± 20oC) without any decreases in modulation. The rugged interferometer exceeds military vibration standards (mil-std-810c, part f).
3. Long lifetime HeNe-laser for wavenumber precision and accuracy.
4. High temperature gas cell with no moving parts gives superior mechanical stability. All sample contact parts are Gold or Rhodium coated for optimum corrosion resistance. Fixed pathlengths for accuracy and reliability from 1 cm up to 10 m.
5. Gold coated one-piece sample cell mirror is precision machined by diamond cutting to provide excellent long term calibration stability.
6. Temperature controlled, low noise MCT detector provides excellent sensitivity. Liquid nitrogen is not needed to achieve precise measurements.
Infrared gas analyzers detect gases based on the absorption of IR light. IR light, just as visible light or radio waves is a type of electromagnetic radiation. The gas molecules absorb this radiation when the electromagnetic field of the molecule vibrates at the same frequency as the incoming IR radiation. The electric field is conventionally measured by the dipole moment, and the absorption signal is stronger for gases with a bigger dipole moment change during the radiation. The animation below illustrates how the electric field of Hydrogen Chloride changes.
The larger brown sphere is the Chlorine atom and the smaller white sphere is the Hydrogen atom. The surrounding colors illustrate electron density (i.e. electric field strength) around the molecule: Density is highest in the green areas and decreases through cyan into blue. All molecules vibrate at their characteristic frequencies determined by atomic mass and the type of molecular bond between the atoms, but the dipole moment change is different for different molecules. For this reason some molecules are very easy to determine from their IR signal (i.e. chlorofluorocarbons) and some do not show any net change and are IR inactive (N2, O2).
