#Product Trends
How to Read a Thermal Image: A Practical Guide
A reliable way to read a thermal image is to start with the scale and measurement conditions, not the most striking color. Check the units, temperature range, palette, and level/span. Confirm whether the file retains radiometric data. A radiometric i
A reliable way to read a thermal image is to start with the scale and measurement conditions, not the most striking color. Check the units, temperature range, palette, and level/span. Confirm whether the file retains radiometric data. A radiometric image is an image file that retains measurement data for use in supported cameras and software workflows, rather than providing only a colorized view. Then check the measurement settings and viewing conditions, look at where the heat is concentrated, and compare the result with a relevant reference.
Electrical Safety Inspection
If the finding could affect a decision, repeat the measurement under comparable conditions, compare it with similar equipment or previous results, use another suitable measurement method, or ask for further review. This is why color alone is not enough: red does not represent a fixed temperature, blue does not automatically mean safe, and a hotspot alone does not confirm a problem.
How to read a thermal image: five checks
Before drawing a conclusion, work through these five checks:
Read the temperature scale. Note the units, displayed range, palette, and whether level and span are automatic or manual.
Check the file. Determine whether the camera and software support later measurement from the original file, or whether you are viewing a flat image or screenshot.
Check the measurement conditions. Record emissivity, reflected apparent temperature, focus, distance, target size, angle, atmosphere, material, and operating condition when they matter.
Read the pattern. Treat a hotspot, cold area, gradient, or edge effect as an observation that needs to be interpreted in context.
Decide what to do next. Retake, compare, confirm with another method, or ask a qualified person to review it.
This helps separate what you see on the screen from what the measurement actually tells you and what action to take next. Start with the scale.
Read the scale before the colors
thermal camera color meanings White Hot
thermal camera color meanings Black Hot
thermal camera color meanings Rainbow
thermal camera color meanings Iron
The color bar connects displayed colors to the current numeric range. A palette is a visual mapping of apparent temperature or radiation intensity. It is not universal that red always means one temperature and blue always means another.
Display element What it tells you What it does not prove
Units The selected temperature unit That the displayed value is valid under every surface or capture condition
Numeric range The values represented by the current color mapping That two images with different ranges are directly comparable
Palette How values are translated into colors for viewing That a color has the same meaning in another palette or software view
Level and span How the displayed range is positioned and spread That changing the display changes the underlying scene temperature
Isotherm or color alarm A configured interval or region highlighted for analysis That the highlighted interval identifies the root cause
A warm-looking red region may simply occupy the upper part of the current scale. A blue region may occupy the lower part, but color alone does not establish that the surface is safe, cold enough, or free from a problem. The same scene can look different when the palette or displayed range changes.
A configured isotherm highlight a selected interval in a contrasting color. Read the legend and configured analysis rule before interpreting the highlight. The display shows how the software presents the selected range, it does not turn that presentation into a diagnosis.
Before comparing two thermograms, record whether each scale was auto-adjusted or manually controlled. A visual difference may reflect a changed range rather than a changed thermal condition. Save the scale, palette, and relevant settings with the inspection record. For more background, see thermal camera color meanings. For an application example, see thermal imaging for HVAC and building inspections.
Check the file, settings, focus, distance, and geometry
Environmental Parameter Correction
Once the display is understood, determine whether the image can support a measurement or only a visual observation.
Radiometric image versus colorized export
A supported radiometric file can preserve measurement data for later use by the camera software. A non-radiometric colorized export or screenshot serves mainly as a visual record. What you can do with the file depends on the camera, software, file type, and export process. Do not assume that every JPG can be remeasured or that every displayed image preserves the original data. If the finding matters, keep the original file when the system supports it and confirm the file behavior in the applicable documentation.
A screenshot may preserve the scene and legend but not the full information needed to change settings or inspect another area later. Treat it as useful context, not automatic proof of quantitative measurement.
Emissivity and reflected apparent temperature
Emissivity is a material measurement input describing how a surface emits infrared energy relative to an ideal emitter. Reflected apparent temperature is the effective temperature assigned to infrared radiation reflected into the camera from the surroundings. Both affect how a camera or software interprets received radiation; neither is a generic accuracy switch.
Materials emit and reflect infrared energy differently. A reflective surface can introduce radiation from the surroundings into what the camera receives, so a displayed number should be interpreted with the material and measurement conditions in view. Do not apply a universal emissivity default or convert one setting into a guaranteed accuracy claim.
Focus, distance, target size, atmosphere, and operating condition
Focus and geometry affect whether the target is represented clearly enough for the intended task. Distance, viewing angle, target size, humidity or atmospheric path, material, and operating condition can affect usefulness and comparability. There is no universal minimum distance, target size, angle, or temperature difference for every camera and scene.
Record the conditions that matter for the application, especially when comparing captures or making a measurement-based decision:
original file and file type, when supported;
units, palette, range, and level/span;
emissivity and reflected apparent temperature;
focus, distance, viewing angle, target size, and material;
load, process state, ambient conditions, and relevant atmosphere.
This checklist supports repeatability. It is not a universal calibration recipe or a substitute for the camera’s documented measurement method.
Read patterns, not individual colors
After checking the scale and capture conditions, read the spatial pattern. A thermal pattern is an observation whose meaning depends on the asset, load, material, angle, history, and repeatability. The image can guide the next inspection step, but it does not identify a defect, leak, moisture source, or root cause by itself.
Pattern observed Initial Next actions
Localized hotspot Load, peer components, focus, target size, material, and repeatability Retake under comparable conditions and compare with a fair baseline
Broad gradient Asset context, operating state, viewing geometry, and capture conditions Check whether the pattern persists under comparable conditions
Cold patch Peer area, target material, operating state, and capture conditions Compare with a similar area or use an appropriate second method
Edge effect Viewing angle, target geometry, and capture conditions Change the view or settings and confirm whether the pattern persists
One extreme pixel or tiny feature Target coverage, focus, neighboring pixels, and repeatability Treat it as a prompt for verification, not a root-cause finding
A hotspot may indicate a condition worth checking, but it does not identify the mechanism behind the observation. Compare the target with similar assets under similar conditions and inspect whether the pattern repeats. A broad gradient or cold patch may come from the asset itself, its operating state, or the way the image was captured. Don’t assume a single cause from the pattern alone.
An edge can look different when the viewing geometry changes. A single extreme pixel or very small feature may be unstable or under-represented. Use line or area context when supported, retake the image when the decision matters, and preserve the capture conditions. Pattern vocabulary is useful only when it leads to a fair comparison or qualified next action.
Compare before you conclude
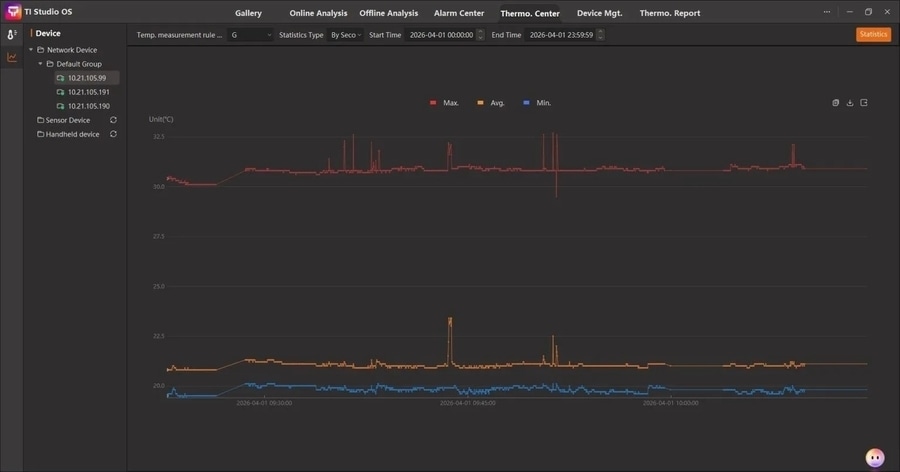
TI Studio thermal camera software displaying historical temperature trend curves for inspection data analysis
A visual difference becomes more useful when the comparison is fair. Compare the same asset over time or similar components under similar load, view, focus, scale, and operating conditions. If those conditions changed, the difference may reflect the capture rather than the asset.
Use this fair-comparison checklist:
same asset or a defined peer group;
documented load or operating state;
similar view, focus, distance, angle, and target coverage;
known units, palette, range, and level/span;
recorded time, ambient conditions, and relevant atmosphere;
repeatability when the finding could change a maintenance or operating decision.
Do not use a universal temperature difference, alarm threshold, accuracy percentage, or pixel rule to decide whether a finding is important. The appropriate limit depends on the application, equipment, measurement method, and decision being supported. A repeatable pattern can justify another inspection step, but the image alone does not establish a regulated defect, leak, moisture source, or cause.
Separate the observation from the decision in the inspection record. For example, record that one component showed a localized higher apparent temperature than a comparable component under the documented conditions. Then record the verification step that follows. This preserves what the image shows without claiming more than the image can establish.
Use measurement and software tools carefully
Measurement tools help organize what the image contains. A spot can report a value at a selected location. A line or area can show variation across a path or region. A mask, delta, reference, or isotherm can define a region, interval, or comparison in a supported interface. These outputs help document a scene, but none establishes a fault or root cause by itself.
Feature availability and behavior vary by camera and software version. Check the applicable documentation before describing a tool as available, remeasurable, or equivalent across products. A palette or isotherm remains a display or analysis choice. It can make an interval easier to see, but it does not convert a color into a diagnosis.
Raythink’s AT31, RM620, and TI Studio demonstrate different combinations of corrections, palettes, measurement rules, isotherms, radiometric analysis, reporting, and export. Feature availability depends on the exact camera model, file type, and software version, so confirm those details before using a feature.
Raythink’s thermal camera software guide explains radiometric reading, measurement tools, reporting, and data export. Before using a feature, confirm the exact model, file type, software version, and output you need. If the task requires later measurement, confirm that the original file and supported workflow preserve the required data.
The useful question is whether the tool’s output is traceable to the image data, settings, conditions, and decision the inspection must support.
Retake, compare, confirm, or escalate
When an anomaly could change a maintenance, safety, quality, or operating decision, use an action ladder instead of a universal threshold table.
Retake comparably. If scale, focus, distance, angle, load, or file status is uncertain, correct the capture conditions and repeat the view. Preserve the original record when supported.
Compare. Use a peer asset or historical baseline with documented settings and operating conditions. A fair comparison helps distinguish a repeatable pattern from a capture difference.
Confirm. Use an application-appropriate second method when the finding matters. Match the method to the question and the decision it must support.
Escalate. Consult the technical team responsible or a qualified thermographer when uncertainty remains significant or the consequences could be serious. Provide the image, scale, file status, settings, geometry, operating conditions, and comparison record.
This ladder is a decision aid, not a regulated procedure. It does not define a universal temperature limit, accuracy percentage, alarm threshold, or minimum pixel count. It also does not turn a pattern into a diagnosis. The purpose is to make the next verification step proportionate to uncertainty and consequence.
In the report, describe what was observed, state the conditions, identify what remains uncertain, and record what will be checked next. This gives the next reviewer enough context to reproduce or challenge the interpretation without treating a color or isolated value as the conclusion.
Record the inspection and choose the next technical step
A useful inspection record gives someone else enough context to understand the image and repeat the same comparison. If the camera and software support it, retain the original file. Record the units, palette, displayed range, level/span, emissivity, reflected apparent temperature, distance, focus, viewing angle, target material, load or process state, time, and relevant environment. Note whether the image is radiometric, a colorized export, or a screenshot, and identify the camera and software version when that affects later analysis.
For examples of how thermal imaging is used across industrial inspection and other application scenarios, see Raythink’s guide to thermal imaging applications. If you are selecting a camera for a specific task, define the application, asset or material, smallest relevant target, working distance or field of view, expected temperature range, measurement purpose, and any radiometric, software, or reporting requirements. These details help determine the imaging and measurement workflow the application requires.
The practical goal is to preserve the scale, data status, conditions, pattern, comparison, and next action so the image supports a sound technical decision.