#Product Trends
Thermal Camera Software for Temperature Analysis, Reports, and Data Export
A thermal camera records temperature differences, but software makes those differences useful for decisions. Many buyers focus on resolution, temperature range, and sensitivity when they choose a camera, then discover later that reporting, data expor
A thermal camera records temperature differences, but software makes those differences useful for decisions. Many buyers focus on resolution, temperature range, and sensitivity when they choose a camera, then discover later that reporting, data export, and trend analysis are the features they use most.
This article explains what thermal camera software does and how it fits into a complete inspection workflow. You will learn how mobile apps, PC clients, and platform software each play a role in capturing images, analyzing temperatures, generating reports, and archiving data for predictive maintenance.
Quick answer: Thermal camera software reads radiometric images, measures spot and regional temperatures, transfers inspection files to a PC, and produces report files for maintenance records. A strong workflow should also preserve original files, measurement settings, exported temperature data, JPG images, and historical trend records, so teams can review both the current finding and the asset’s longer-term condition.
What Thermal Camera Software Does
Thermal camera software is the application that reads, processes, and organizes the images your camera captures. In most cases, it runs on a PC, a mobile device, or both. Some systems also use platform software that manages multiple fixed cameras from a central location.
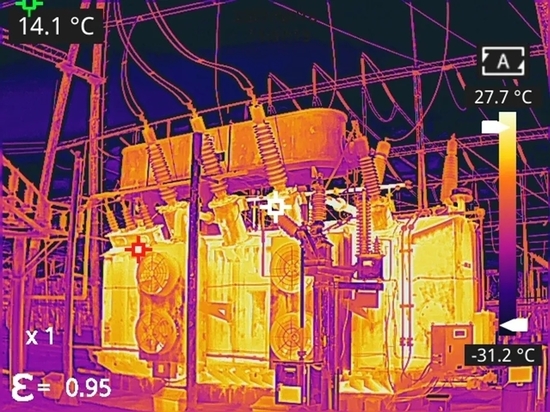
The images a thermal camera produces are called radiometric images. Unlike a standard photo, a radiometric image stores a temperature value for every pixel. That means you can open the image later, place measurement points anywhere, change color palettes, and adjust settings without retaking the picture. Without software that can read this data, the image is just a colored picture with no measurable information.
Core functions of thermal camera software include:
Image viewing and organization — open, sort, and store thermal images by date, asset, or inspection route.
Temperature measurement — read spot temperatures or analyze regions for minimum, maximum, and average values.
Image adjustment — changes palettes, isotherms, temperature scale, 3D view, and level/span to improve readability.
Measurement markup — use points, lines, circles, rectangles, polygons, and area shielding to explain what the image shows.
Multi-channel analysis — preview and analyze up to four channels for real-time review or comparative analysis across different targets.
Trend analysis — track temperature history for specific assets and spot gradual changes.
Reporting — generate professional temperature analysis reports with configurable templates.
Data export — export original temperature data and JPG images where supported.
These functions group naturally into four stages: capture, analysis, reporting, and archive. Each stage has different software requirements.
Stage 1: Capture and Field Review
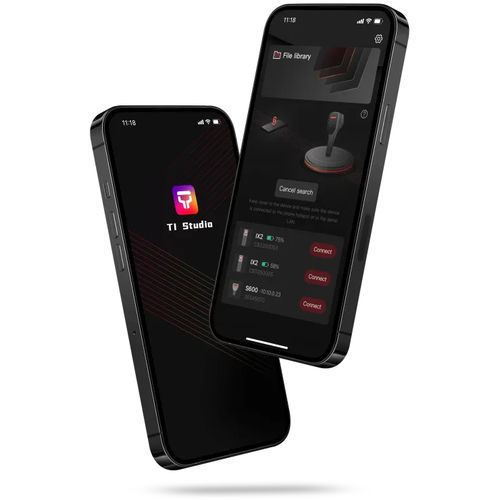
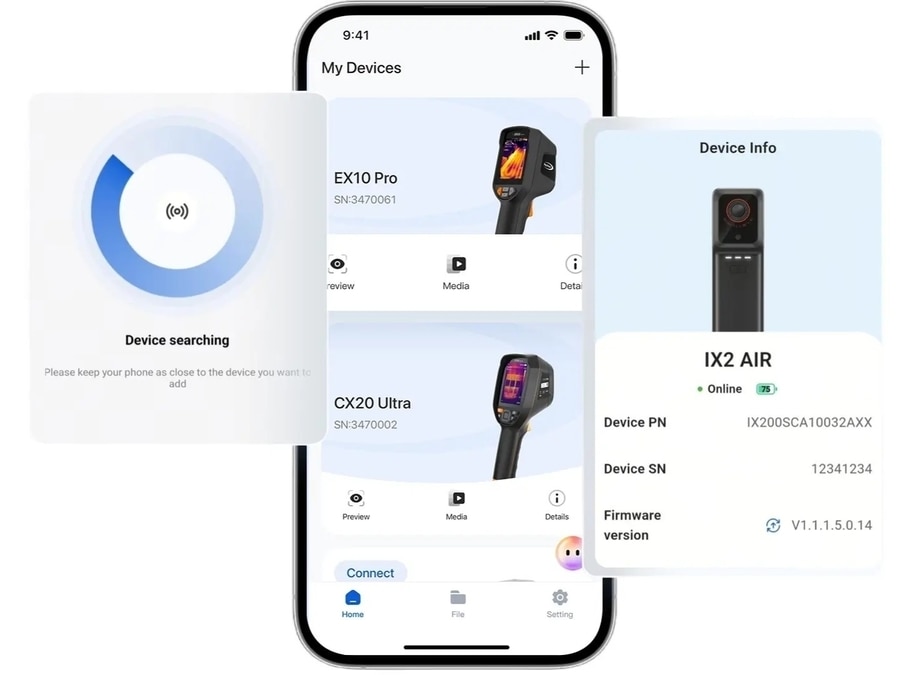
Raythink TI Studio mobile app for handheld thermal camera device management and field review
The capture stage starts the moment you take an image. Many modern handheld thermal cameras let you add measurement points, draw analysis areas, and set alarms directly on the camera screen. This is useful when you need a quick answer in the field and do not want to wait until you are back at a desk.
Mobile apps extend this capability. A mobile app connected to the camera over Wi-Fi lets you:
Review images on a larger screen than the camera display.
Share findings immediately with supervisors or maintenance planners.
Add notes or mark images for follow-up before leaving the site.
Share generated reports or inspection images through supported mobile sharing workflows.
Mobile review works well for routine inspections and fast troubleshooting. For detailed reports, certificates, and exported data, a better workflow is to capture and screen images in the field, then move the original files to a PC for deeper analysis. Raythink’s TI Studio Mobile Client supports this first stage by helping inspectors analyze raw infrared images before they leave the asset
Stage 2: Temperature Analysis
Once images move to a PC or larger screen, the analysis stage begins. This is where software adds the most value, because radiometric images contain far more information than a single temperature reading.
Spot, Line, and Area Measurements
The simplest measurement is a spot temperature — the value at one pixel or a small group of pixels. Most software also supports line profiles, which show how temperature changes along a straight line, and area measurements, which report the minimum, maximum, and average temperature inside a defined region.
TI Studio thermal camera software showing spot, line, and area temperature analysis on a thermal image
Area measurements are especially useful for electrical panels, mechanical assemblies, and building envelopes. Instead of relying on one spot, you draw a box or circle around the component and read the minimum, maximum, and average values. For example, a busbar inspection may need both the hottest point and the average temperature across the connection.
Region of Interest (ROI) Tools
A region of interest is any area you define for focused analysis. In TI Studio PC Client, measurement rules can include points, lines, circles, rectangles, polygons, and area shielding. For online or real-time analysis, these rules can also work with temperature alarm settings.
ROI tools matter because industrial inspections rarely involve one hot spot. A motor may have several bearings, and a panel may have dozens of breakers. Consistent measurement areas help teams review the same component or zone across repeated checks.
Measurement Settings and Surface Conditions
No temperature measurement workflow is reliable without a consistent setup. Emissivity describes how well a surface emits infrared radiation. Shiny metals such as copper busbars have low emissivity and can produce misleading readings unless the inspection method accounts for the surface condition.
Software helps preserve the measurement record, but it cannot fix a poor field setup. For repeatable analysis, record the target surface, camera distance, viewing angle, and measurement rule used for the inspection.
Color Palettes and Alarms
Color palettes translate temperature into visible contrast. Different palettes work better for different scenes. A high-contrast palette may help you find a hot bearing, while a grayscale palette may reduce visual fatigue during long review sessions.
Temperature alarms are mainly applied in real-time or online analysis. Unless otherwise specified, the alarm features discussed in this article refer to these monitoring scenarios.
For real-time monitoring, Raythink’s TI Studio PC client supports temperature alarms, temperature-rise alarms, separate settings for the full frame and individual measurement rules, multiple alarm thresholds, and alarm linkage methods such as sound, snapshot, recording, and I/O linkage.
Stage 3: Report Generation
After analysis, the next step is to communicate the findings. A thermal image may be clear to the person who took it, but a maintenance manager, compliance officer, or customer needs context, numbers, and a professional format.
What a Good Report Includes
A useful inspection report usually contains:
Header information: site, date, inspector, equipment ID.
Thermal images with visible-light overlays or picture-in-picture when available.
Measurement data: spot, line, and ROI temperatures.
Measurement rules, comments, or severity notes.
Measurement settings and inspection conditions used.
Recommendations: repair, monitor, or no action.
Company branding and signatures for compliance documents.
Report Templates
Templates save time when you perform the same type of inspection repeatedly. Instead of building a report from scratch, you select a template that already includes the right sections, logos, and formatting. Some software lets you create custom templates for electrical inspections, mechanical inspections, or building audits.
Template-based reporting also improves consistency, so reports from different inspectors follow the same structure.
Output Formats
The most important report output is a clear temperature analysis report that can be shared with maintenance teams, quality teams, or customers. For Raythink workflows, use the report output and template functions confirmed for the specific camera and software version instead of assuming every common office format is available.
Report Scope
Reports are not the same as certificate management. If the customer has a separate camera calibration certificate, treat it as a device document, not a report generated by TI Studio. If a quality process requires calibration traceability, store that document in the customer’s own document-control workflow and reference it outside the software report when needed.
Stage 4: Data Export and Archiving
Reports are the visible output of an inspection, but the underlying data is what supports long-term maintenance decisions. Thermal camera software should make it easy to export both images and temperature data in formats that fit your workflow.
PC Transfer
PC transfer is the bridge between field capture and final documentation. If the file is only saved as a flat JPG, the PC software may not be able to re-measure the image later. If the original radiometric file is preserved, the analyst can adjust measurement areas, review temperature values, generate reports, and export data after the inspection.
For routine handheld inspections, use a simple rule: transfer the original files first, then create distribution files. Original radiometric files are for analysis and archive. Report files are for review and sharing. Exported original temperature data is for trend review. JPG images are for quick visual sharing.
Image Export
Image export is the simplest form of output. For the Raythink software workflow covered here, treat JPG as the confirmed image export format unless another format is verified for the exact software version. A JPG is easy to share, but it is normally a visual output, not the original analysis file.
JPG works well for quick visual sharing. For future measurement, keep the original thermal file format supported by the camera and software.
Temperature Data Export
For deeper analysis, you need the actual numbers. CSV and Excel export let you move temperature data into spreadsheet tools or database systems. This is useful when you want to:
Review temperature trends across many inspections.
Store temperature records outside the camera software.
Share raw values with engineering or maintenance teams for further review.
CSV export is particularly valuable for fixed monitoring systems that need to transfer recorded temperature data for analysis, reporting, or integration.
Archiving Strategy
Long-term archiving should balance accessibility, storage size, and data integrity. A practical approach is:
Keep radiometric originals in a backed-up file system or document management platform.
Export reports for distribution and review files.
Export raw or original temperature data for trend review.
Organize files by asset, date, and inspection type so you can find historical data quickly.
Without a clear archive strategy, valuable temperature history can disappear across individual computers or camera memory cards.
Historical Data and Trend Analysis
TI Studio thermal camera software displaying historical temperature trend curves for inspection data analysis
Asset-Based Temperature Records
Trend analysis starts with linking each image to an asset. Instead of filing images by date alone, you tag them by equipment ID: Motor 7, Transformer B, Panel 2A, and so on. Software that supports asset libraries makes this easy.
Once images are tied to assets, you can plot temperature over time. A bearing that rises from 45°C to 67°C over three months is sending a different message than one that jumps to 67°C in a single day. The first suggests gradual wear; the second suggests a recent lubrication or loading problem.
Baseline and Historical Review
A baseline image is a reference capture taken when the equipment is known to be healthy. Future inspections can be reviewed against that baseline by using consistent measurement rules and archived records.
Do not assume automatic baseline comparison unless the exact software version confirms it. Baseline review is still useful after maintenance because a follow-up image can show whether the repair reduced the abnormal temperature.
Where Trend Analysis Adds Value
Trend analysis delivers the most value in applications where gradual temperature change predicts failure:
Electrical panels: loose connections and oxidized contacts generate increasing resistance and heat.
Rotating machinery: bearings and gearboxes heat up as lubrication degrades or alignment shifts.
Building envelopes: insulation gaps and moisture ingress create persistent thermal patterns.
Process equipment: furnaces, heat exchangers, and reactors develop hot spots as fouling or refractory wear progresses.
For fixed or online monitoring systems, trend analysis is often built into the platform software. Raythink’s VIS Patrol PC Client collects temperature data periodically for the full frame and for individual measurement rules, then generates trend curves and exports raw data for further analysis.
How to Choose the Right Thermal Camera Software
The best software for your team depends on your inspection workflow, not just the camera brand. Use these criteria to evaluate options.
Camera Compatibility
First, confirm that the software reads your camera’s file format. Not all thermal image formats are interchangeable. If you switch camera brands, you may need new software or a conversion tool. Bundled software from the camera manufacturer usually offers the best compatibility.
Export Flexibility
Match export options to your workflow. If you only need report output and JPG sharing, basic software may be enough. If you need raw temperature data, confirm the export function and exact file format before planning spreadsheet or database work. If you record radiometric video, confirm that the software can play it back before you build the workflow around it.
Report Template Customization
If your reports must include your company logo, specific sections, or compliance language, look for template customization. Some free or entry-level packages offer fixed templates only.
Mobile and PC Integration
A strong workflow combines mobile review for speed and PC analysis for depth. Check whether images must be transferred manually or whether cloud resource sharing is enabled for your device and account. TI Studio PC Client describes a cloud-platform connection for images and videos synced from handheld devices, but this should be confirmed for the exact deployment.
Scalability
Handheld inspections need mobile apps and PC clients. Fixed or online monitoring systems need platform software that can manage multiple cameras, handle alarms, and store long-term data. If your program may grow from handheld route-based inspections to continuous monitoring, choose a vendor whose software scales across both models.
Support and Updates
Ask about software updates, training resources, and technical support. A camera with excellent hardware but neglected software can become a bottleneck. If you are choosing a handheld thermal camera, evaluate the PC client and mobile app as part of the same buying decision.
Example Workflows Using Raythink Software
The best way to judge thermal camera software is to look at the full customer workflow. The examples below show how reports, PC transfer, regional measurement, alarms, and historical data work together.
Electrical Cabinet Inspection with RM620 and TI Studio
In an electrical routine inspection, an inspector using an RM620 handheld thermal camera may capture thermal images of breakers, busbar joints, cable terminals, and loaded components. The camera supports custom points, lines, and areas, so the inspector can mark the component that needs attention before leaving the cabinet.
After the field check, the team transfers the original files to a PC through the available camera workflow, such as Wi-Fi, USB, USB-C, or SD card. In TI Studio PC Client, the analyst can review the radiometric image, adjust measurement areas, export original temperature data where supported, and prepare a report. The final documentation set may include the report, exported temperature data, original files, visible-light references, and JPG images.
This workflow answers several customer concerns at once: the report explains the finding, PC transfer preserves the data, area measurement adds context, and historical records show whether the same connection is getting hotter over time.
Fixed Monitoring with VIS Patrol PC Client
VIS Patrol software interface showing thermal and visible camera feeds for remote monitoring
For fixed or online monitoring, the workflow is different. A team may monitor electrical rooms, process equipment, or other assets where temperature history matters more than one inspection image. VIS Patrol PC Client fits this workflow because it manages devices, playback, alarms, and infrared temperature data.
For temperature-measurement devices, VIS Patrol can periodically collect full-frame and measurement-rule temperature data. It records maximum, minimum, and average temperatures, generates trend curves, and exports raw data for historical review or outside analysis.
Specialized Platform Software
Raythink’s platform software is better suited to specialized monitoring programs than to ordinary handheld report work. VIS-3100 supports forest fire prevention workflows, while VIS-4100 supports wide-area site monitoring and event review. These platforms fit customers who need centralized monitoring rather than a simple handheld inspection report.
Conclusion
Thermal camera software is not an afterthought. It connects captured images with measurements, reports, and maintenance decisions. A complete workflow moves through four stages: capture and field review, temperature analysis, report generation, and data export with archiving.
For occasional troubleshooting, mobile apps and basic viewers may be enough. For predictive maintenance, compliance documentation, and integration with facility systems, you need a PC client or platform software with strong export, reporting, and trend analysis capabilities.
If you are planning a thermal inspection workflow and want to match the right software to your cameras and maintenance goals, contact Raythink for a personalized consultation or software demo.
FAQ
What is the difference between thermal camera mobile apps and PC software?
Mobile apps are designed for quick field review, device management, image analysis, report generation, and sharing. They work well when you need fast confirmation or want to send an image to a supervisor immediately. PC software offers deeper analysis, more measurement tools, multi-channel preview, report templates, real-time alarm workflows, trend curves, and original temperature data export. Most inspection programs use mobile apps for speed and PC software for documentation.
Can I export temperature data from thermal camera software?
Yes, if your camera captures compatible thermal data and your software supports data export. Raythink’s TI Studio PC Client supports exporting collected original temperature data, and VIS Patrol PC Client supports exporting raw temperature data. Before buying, confirm the exact export format; do not assume a spreadsheet-ready file unless that format is listed for the software version.
What should a thermal inspection report include?
A useful report includes the inspection date, site, equipment ID, thermal images, visible-light references, measurement data, measurement rules, comments, and recommended actions. If the inspection requires calibration traceability, handle any separate camera calibration document outside the software-generated report.
Do I need special software for predictive maintenance with thermal cameras?
You need software that supports historical trend analysis and reliable data export. Predictive maintenance depends on comparing current temperatures to previous readings, not on single snapshots. Look for software that can collect temperature data, generate trend curves, and export raw or original temperature data for further review.